MU added new metrics to its COVID-19 dashboard Tuesday. UM spokesperson Christian Basi said the changes are responses to community feedback, but others said the resource still provides insufficient data.
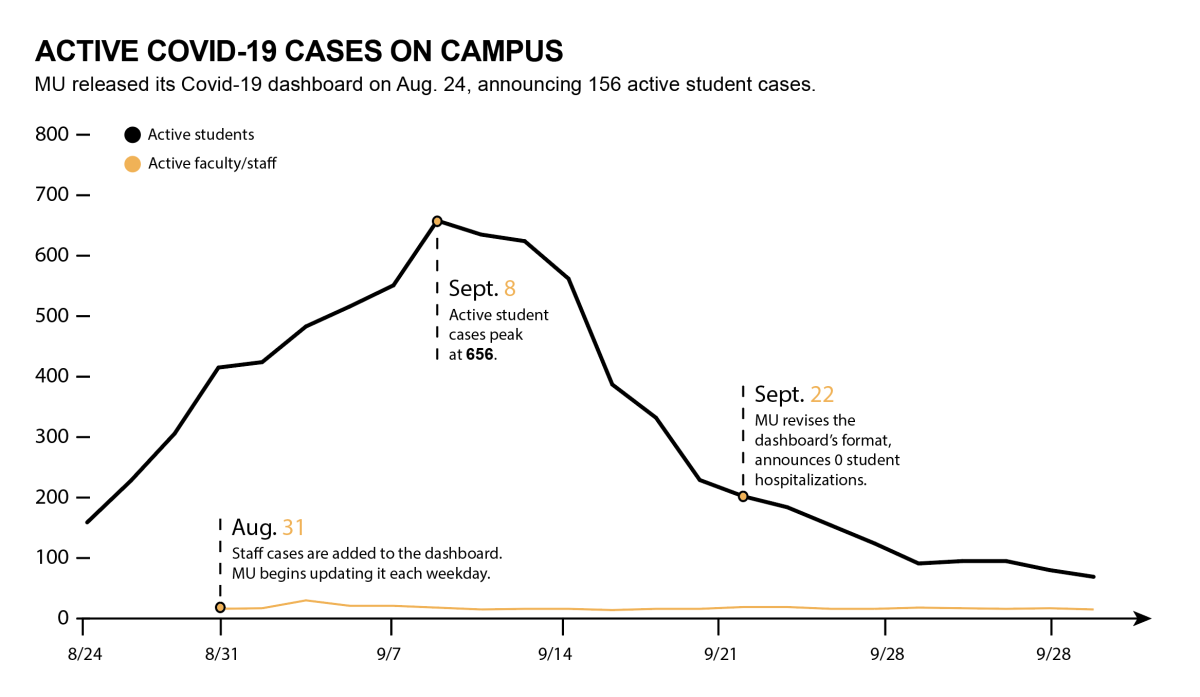
The dashboard began tracking cases on Aug. 19 and has reported three metrics consistently since then: the number of active student cases, the percentage of the student body currently sick with COVID-19 and the number of students who have recovered. The dashboard began reporting staff cases on Aug. 31 and the daily net change in new cases on Sept. 3 in the site’s fine print. The dashboard has shown the cumulative number of cases in the fine print since the website launched.
Tuesday’s update displayed the cumulative case count more prominently on the page and provided a table showing a three-day progression of daily new cases. The update also added a figure for the total number of hospitalized students.
Besides the number of hospitalizations, none of these numbers are new. Basi said the university added to the dashboard because people had told him the figures in fine print were easy to miss.
“Based on the conversations we had with individuals, it was clear that they were not seeing that [additional information] regularly,” Basi said. “And so we felt that this design change would address that concern, even though the numbers have been there.”
A spokesperson from the Missouri Coalition for Covid Safety, a group campaigning for a more hardline COVID-19 response from UM System administration, said the dashboard is “pathetically inadequate” even with the changes.
The spokesperson said the dashboard does not account for asymptomatic and sick students who do not receive tests. They also said the dashboard should show where outbreaks originated as well as the race and ethnicity breakdowns of student cases since COVID-19 disproportionately affects minority groups.
Basi said MU has reasons for excluding these metrics from the dashboard. He said the university does not track cases by race or ethnicity because the administration is focused on supporting “each individual student for their specific circumstances,” and the dashboard does not display outbreak locations to protect students’ privacy. Basi said the university does track these locations for internal data.
The dashboard also does not track the number of students in campus quarantine housing. Basi said showing the number of students in quarantine would be misleading because many students have quarantined off-campus.
Mackenzie Beaver, a sophomore who serves as the MSA senate speaker, said the dashboard should include one more metric: a student positivity rate. Beaver authored a bill that calls for MU to add this figure to its dashboard. Senate Bill 60-3 passed Sept. 8.
Beaver said this data should be easy to provide. Not providing it, she said, leaves students in the dark about the state of the pandemic on campus.
“We know it’s data that exists,” Beaver said. “We’ve already seen it be incorporated on other large university dashboards, including places like Notre Dame. It helps paint a clearer picture about what the actual COVID situation is like at our university.”
Basi said reporting a student positivity rate is currently impossible because Columbia/Boone County Public Health and Human Services does not track how many MU students have received tests.
Columbia/Boone County Public Health and Human Services provides MU with its COVID-19 data. Assistant director Scott Clardy said the county does not require health care workers to ask people their occupation when they get tested. He said this would slow down the process and create ethical concerns if the results are negative.
Beaver said it should be possible to ethically and efficiently track a student positivity rate since other universities are doing it on their dashboards.
The county has a COVID-19 tracker of its own. Basi said watching both the university’s and the county’s dashboards provides the most accurate picture of the pandemic in Boone County. The county tracker lists metrics MU’s dashboard does not, including countywide positivity rate, information by ZIP code and school district, race and age breakdowns of cases and sources of exposure.
The county dashboard also tracks the total number of cases and daily new cases among the 18-to-22 age group, which includes most of MU’s students but also encompasses Columbia’s other college students and young adults. Clardy said the county also internally tracks the positivity rate among the age group, which was 35.53% from Sept. 7 to Sept. 20.
“If there was a desire to have that information out there, we could certainly do that,” Clardy said. “We add things to the dashboard all the time. We haven’t had a request to report this kind of information, but we could. There’s no reason we couldn’t if people wanted to see it.”
Basi said MU’s dashboard shows the university’s COVID-19 response is working — it reports that MU had 124 active student cases on Sept. 23, a 62.65% decrease from a week before on Sept. 16. Zero students have been hospitalized, Basi added. The dashboard also shows that just 11 faculty members have tested positive, and Basi said this suggests COVID-19 is not spreading in classrooms. However, faculty self-report positive results, so the figure on the MU dashboard may be an underestimate.
The site We Rate Covid Dashboards, which assigns letter grades to college COVID-19 trackers based on the site’s own rating scheme, gives MU’s dashboard a B minus.
Yale School of Medicine professor Cary Gross, one of the creators of the site, said the dashboard earned points for daily updates and separate student and staff case reporting. However, Gross said MU’s dashboard has limitations.
“A clearer description of # tested, result lag-time, and testing strategy would be helpful, as would clearer tracking of community covid rates,” Gross wrote in an email. “We note that there are over 1,500 covid cases to date, which reinforces the importance of data transparency. We’re all trying to figure this out as we go, and we wish the Mizzou community well.”
_Edited by Joy Mazur | jmazur@themaneater.com_