Every fall MU puts out an infographic, called the Student Body Profile, breaking down the enrollment numbers at MU. These infographics have been realized for over a decade now, but for the sake of keeping the numbers relevant, the numbers reviewed here date back to 2011. Looking back at the last decade of numbers, insights can be gained ranging from the average ethnic makeup of Mizzou’s population to the state that sends the most students to Mizzou.
The numbers are collected from MU’s own database. Due to the nature of how the numbers are presented to the public, not all the numbers are available so some averages will be affected by this slightly. No number that is severely affected by this will be presented but it is still worth noting. Further, due to the time frame of the numbers, some programs changed, introduced or were related which may affect the outcome.
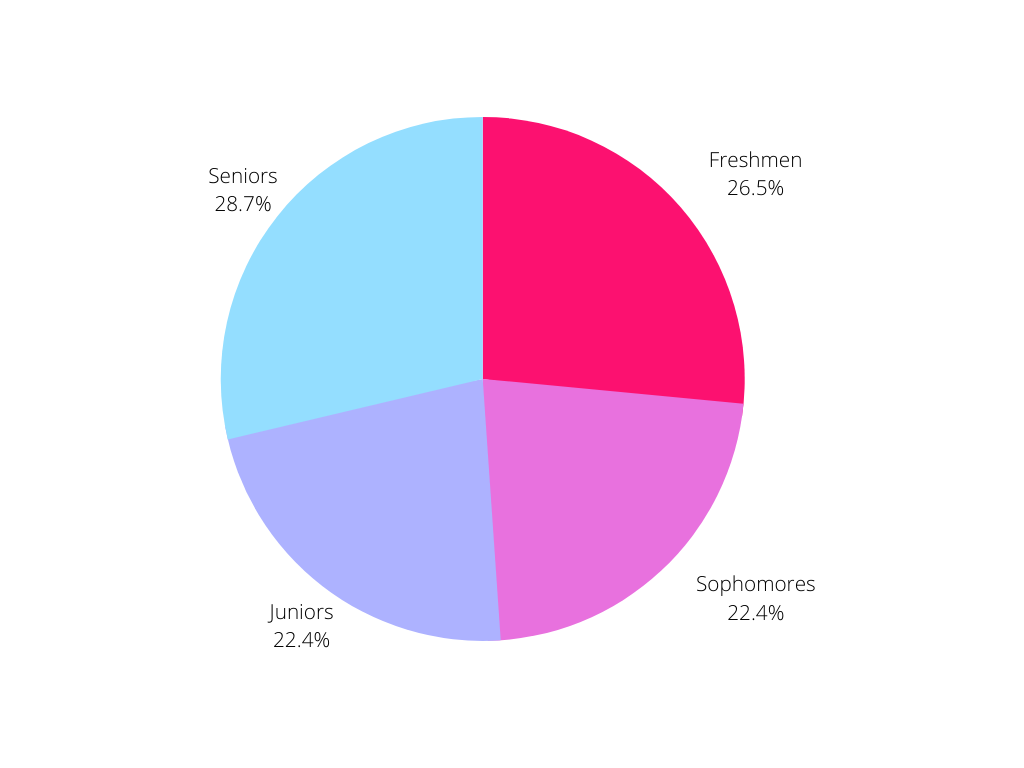
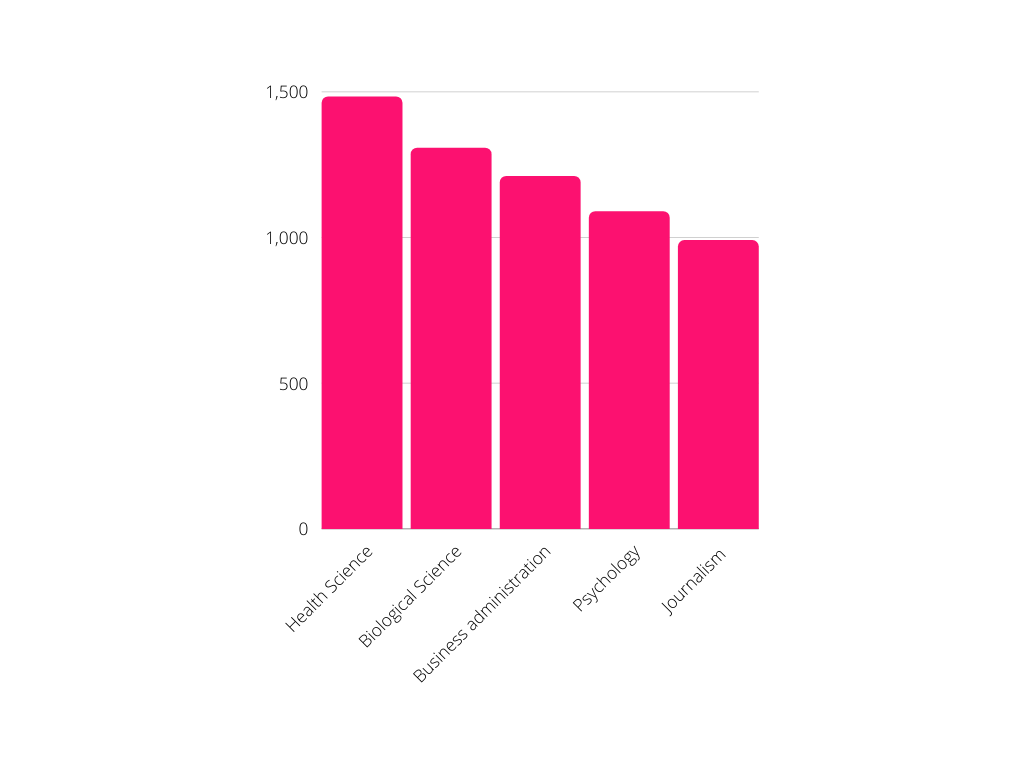
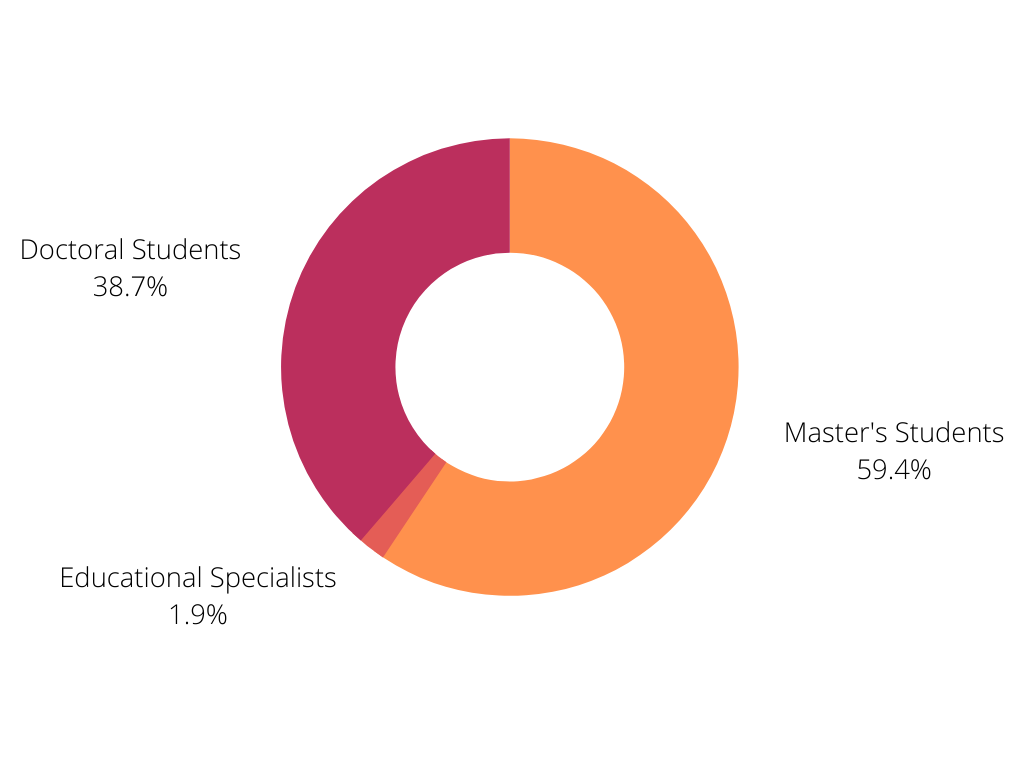
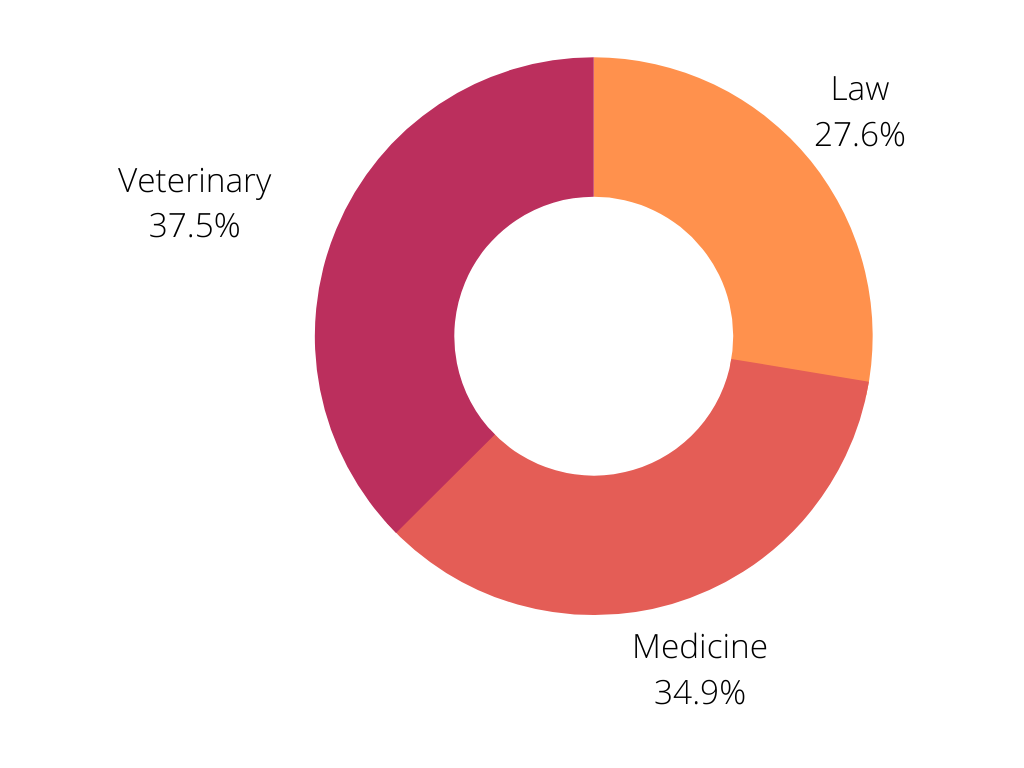
From those numbers, it can be said that the most popular graduate-level courses are master’s programs, the largest undergraduate class level is seniors and the most popular professional school is the School of Veterinary Medicine. As for undergraduates, the most popular major is health sciences.
As for ethnicity, the Student Body Profile breaks down the total ethnic makeup of students for each year. The most common ethnic background at MU, making up 76% of the student body, is white students, with an average of 24,917 students. The next largest percentage, filling 6.85% of the student body, are Black students with 2,245. For the rest of the five largest ethnic backgrounds at MU, 5.96% are non-residents (any student who is not from the U.S), 3.76% are Latino students and 3% are multiracial students.
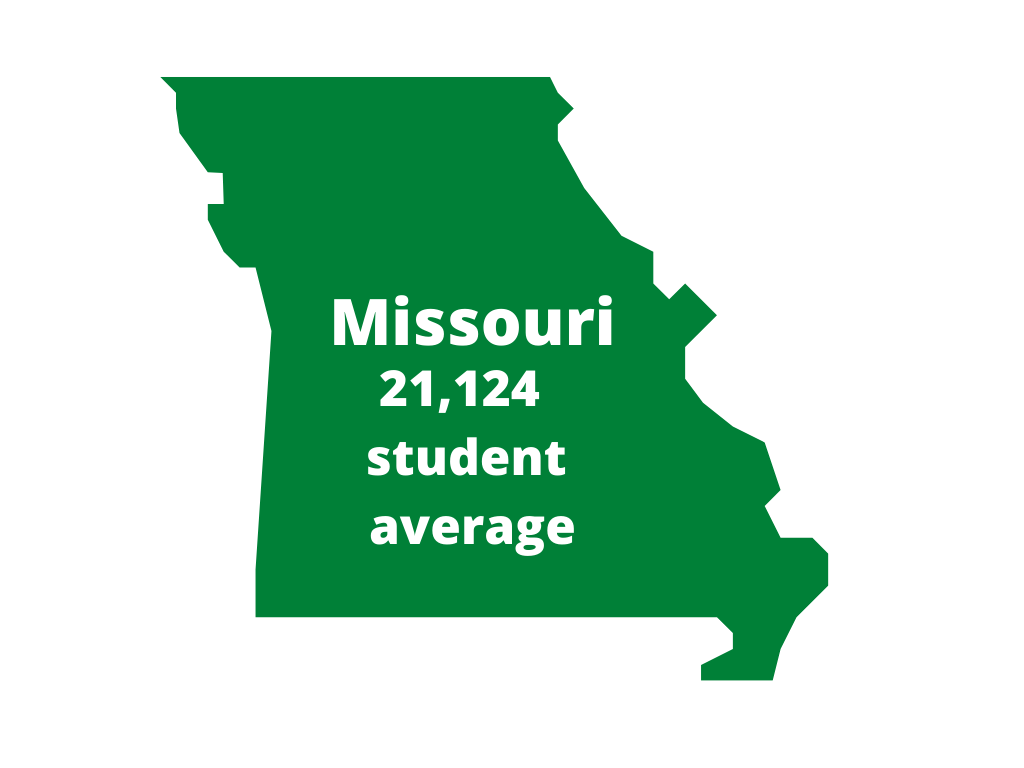
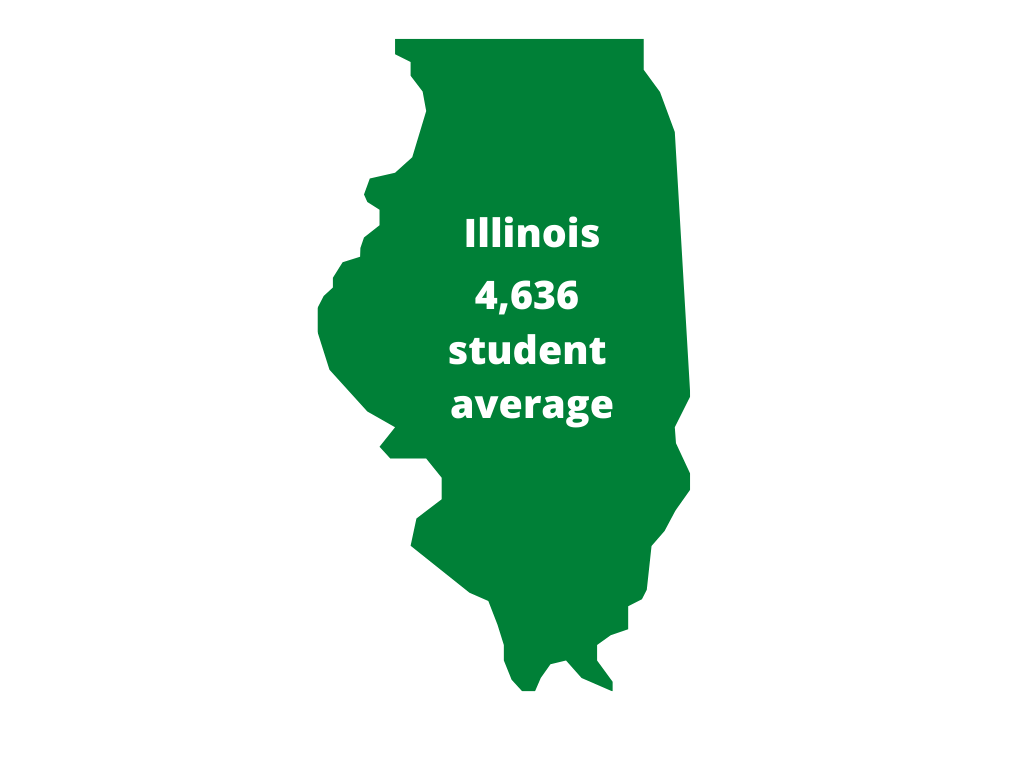
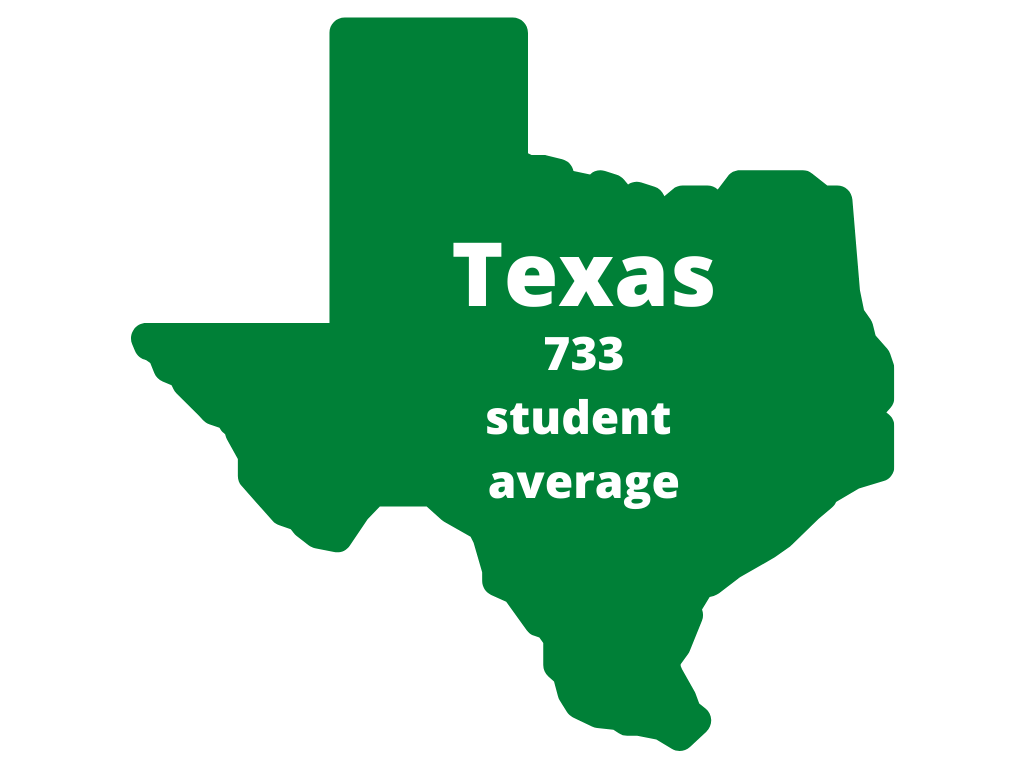
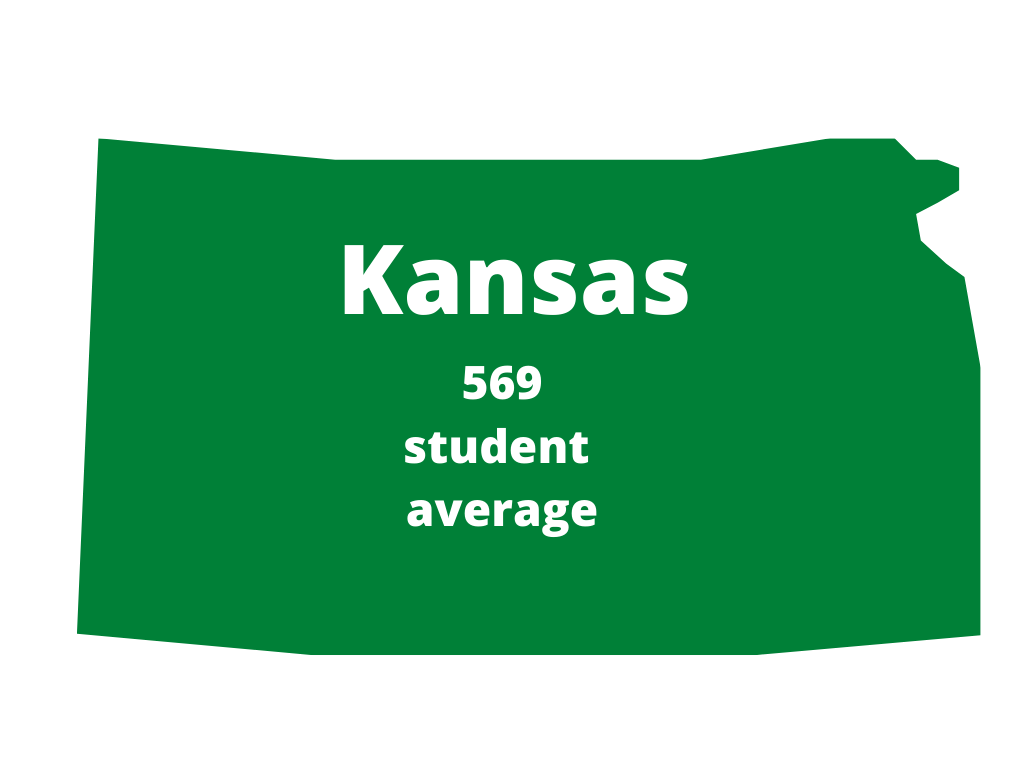
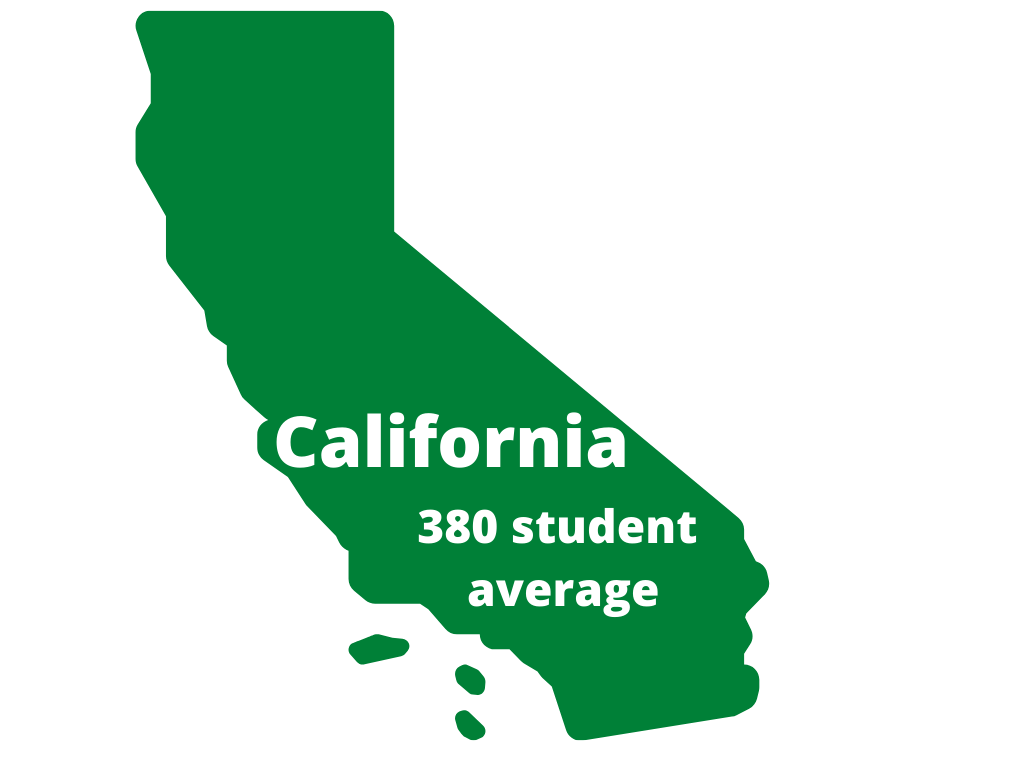
The Student Body Profile ranks the top feeder U.S. states, the states that send the most students to MU. Ranking at the top is Missouri with an average of 21,124 students per year. The next largest feeder state is Illinois with an average of 4,636 students per year. The rest of the five states with the highest yearly averages are Texas with 733, Kansas with 569 and California with 380, on average.
For international students, the Student Body Profile outlines the feeder countries with the highest yearly average. At the top is China with 922 students coming to MU on average every year. Making up the rest of the top five countries, 164 students from India attend MU, 145 students from South Korea, 61 students from Iraq, 57 students from Saudi Arabia and 41 students from Iran.
To access the numbers used in this story, search “Mizzou Student Body Profile” followed by the year you wish to look at. New numbers are posted every fall semester.
Edited by Namratha Prasad, nprasad@themaneater.com
Copy edited by Abby Woloss and Jacob Richey, jrichey@themaneater.com
Data edited by Olivia Gyapong, ogyapong@themaneater.com